
When it comes to competitive exams like JEE, BITSAT, etc., there lies a lot of importance on self-analysis as well as comparative analysis. It helps in bringing the best out of you and make you exam-ready.
Unless you don’t judge yourself or do a self-analysis of your preparation, you can’t take a step forward. Just like that, you also need to give attention to how you’re faring against the best by doing comparative analytics. Comparison forms the core of your preparation.
myPAT provides state-of-the-art features and out of those features, Comparative Analysis and Behavioural Insights, are two such features which are crucial when it comes to improving your performance.
Let’s discuss these features in a detailed step-by-step manner. Read on:
Comparative Analysis
myPAT’s Comparative Analysis or Comparison section comes under the Test Analysis section. It’s a very crucial feature as it helps you compare your performance with that of a topper as well as an average student.
The Comparative Analysis feature can be done in these 5 steps:
- Student Representation through Colours
- Comparison by different Parameters
- In-depth Comparison using Filters
- Problem Identification
- Finding Solution to the Problem
Let’s further understand these 5 steps thoroughly, with examples:
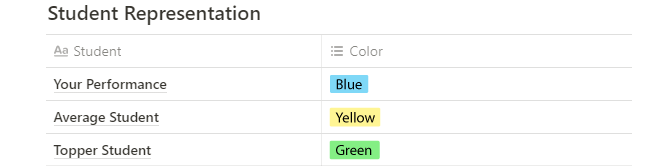
1. Student Representation through Colours
The student representation is the first step to be followed while doing comparative analysis. Your performance is represented by the colour “Blue”. The average student’s performance is shown by the colour “Yellow”. The topper’s performance is indicated by the colour “Green”.
The colour segregation looks like the below picture:
2. Comparison by different Parameters
The next step would be to compare your performance using different parameters, given under the ‘Compare By’ section on the sidebar. Those parameters are:
- Subject/Concept wise
- Difficulty wise
- Question Type (MCQ/Numerical/Matrix)
- Skill-wise question (Conceptual/Analytical/Intuitive)
You can choose any of the above parameters to compare your performance with an average student and a topper. It looks like the below-given picture:

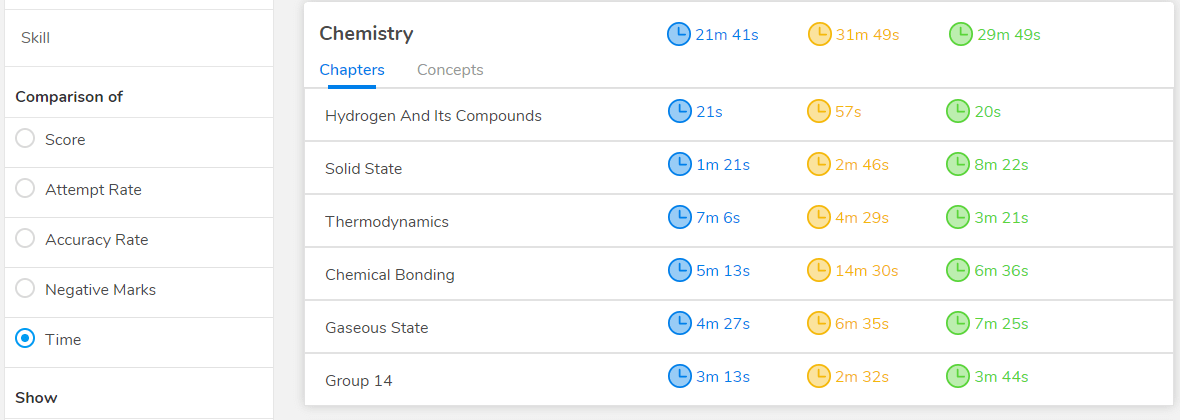
3. In-depth Comparison using Filters
Next, you can further make an in-depth comparison by using the filters given on the sidebar under the ‘Comparison of’ section. You can easily choose to view the comparison under these filters:
- Test Score
- Attempt Rate
- Accuracy Rate
- Negative Marks
- Time Taken
You also have the option to view the subject-wise analysis to help you figure out the list of chapters/concepts which require an extra effort from your side to score better.
An example of the comparison filter is shown in the picture below:
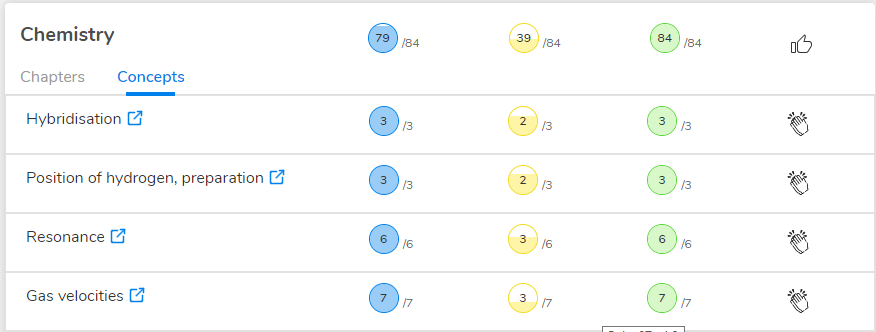
4. Problem Identification
Once you complete your analysis using the filters mentioned above, the next step is to identify the problem. For example, under the ‘Concepts’ tab, you have the option to check whether the answer is correct or not and view its solution by clicking the (![]() ) button against it. Here’s how it looks like:
) button against it. Here’s how it looks like:
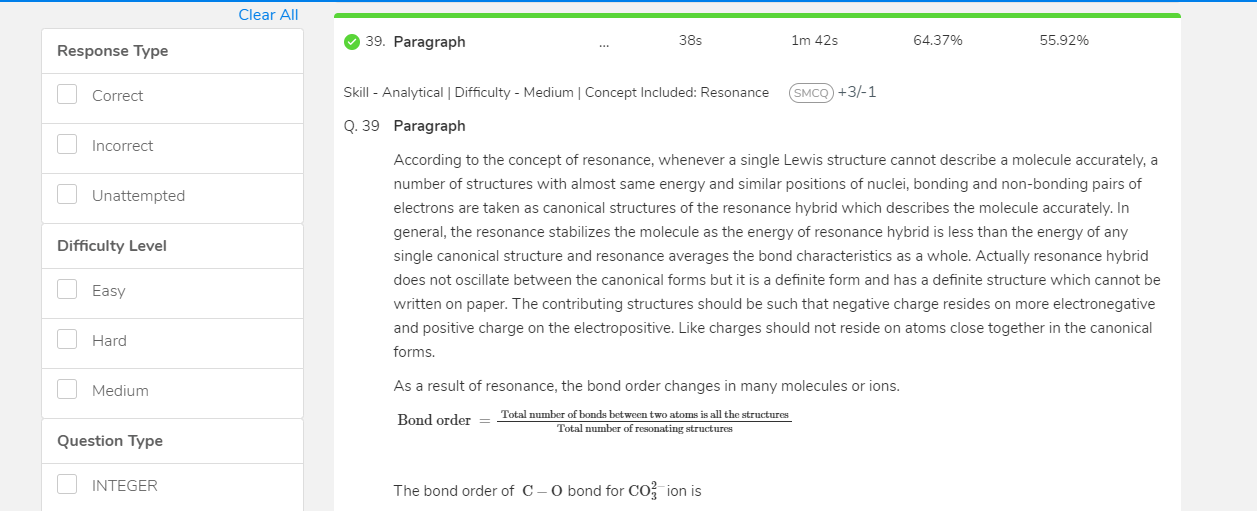
Once you click the (![]() ) button of any particular concept under any subject, Resonance, in this case, you’ll be redirected to the questions falling under that concept. You’ll see something like the below picture on your screen:
) button of any particular concept under any subject, Resonance, in this case, you’ll be redirected to the questions falling under that concept. You’ll see something like the below picture on your screen:
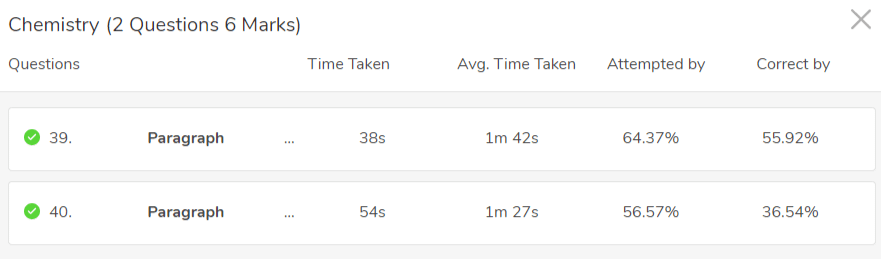
Note: The colours against the question number represent the following:
- Green Colour– Correct Attempt
- Red Colour– Incorrect Attempt
- Grey Colour– Not Attempted
5. Finding Solution to the Problem
Once you see the above-shown screen, you’ll now be on the last step of completing your analysis. Click on any of the ‘Time Taken’, ‘Avg. Time Taken’, ‘Attempted by’ or ‘Correct by’ metrics. You’ll be able to view the correct answer and solution from there.
The solution to your question would look like this:
Behavioural Insights
The above was all about myPAT’s Comparative Analysis that helps you compare your performance using different parameters. Let’s move on to another important feature, that is Behavioural Insights.
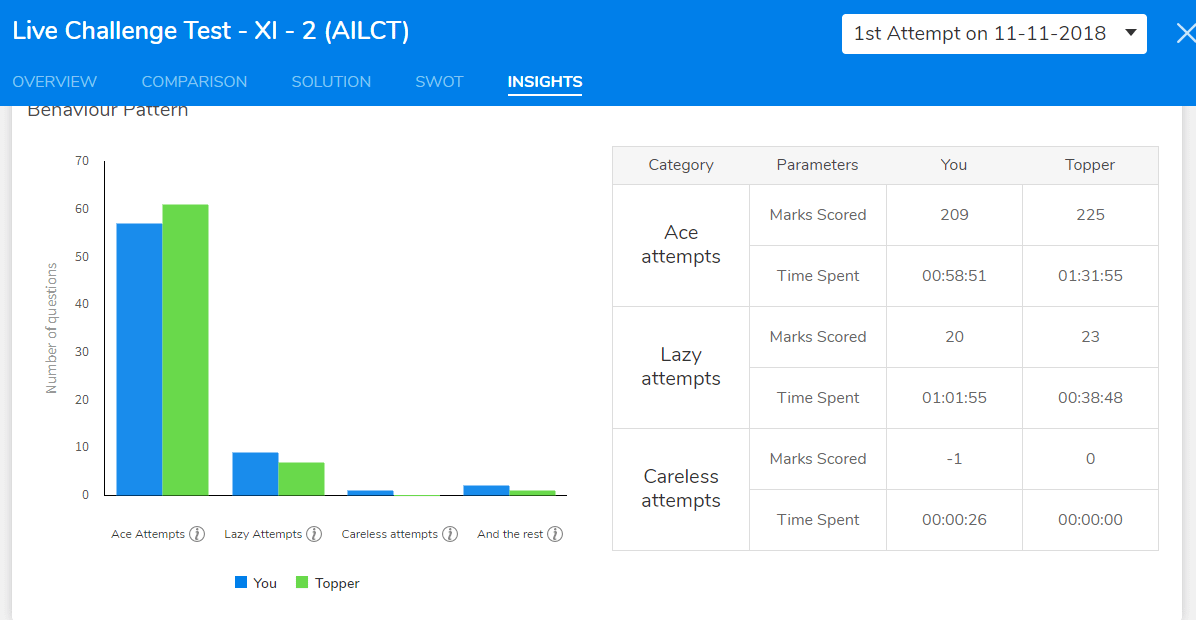
It helps you to improve your test attempt strategy as it provides your specific, actionable items that can boost your performance. It gauges the time taken by you and topper by two parameters – Marks Scored and Time Spent.
These parameters are categorised in three ways:
- Ace Attempts – Questions attempted well within time
- Lazy Attempts – Questions attempted in more than average time
- Careless Attempts – Questions attempted without any clarity
The Insights tab in your test analysis looks like the following pictures:
These two are significant features that help you ace the goal examination. If you want to read more about SWOT Analysis, click here.
Read Also: How to use myPAT?
There’s another critical feature of myPAT’s Test Analysis, which is the Solutions feature. You can view the solutions to all your test attempts by clicking on the Solutions tab. The questions, as well as their solutions, are curated by FIITJEE experts, who’re the best in the business.
Here’s a sneak peek of the Solutions tab available on myPAT’s test result analysis:

You can further apply filters to check your solutions, based on:
- Response Type
- Difficulty Level
- Question Type
So, what are you waiting for? With such an in-depth and detailed analysis that myPAT provides, there’s nothing else that you need!
And now you know what you need to do for a thorough analysis of your test attempts with myPAT’s awesome features. Start exploring the world of myPAT, right away!